Balanced Scorecard — measure strategy from four perspectives, not just finance
If you look at a business through financial numbers alone, you can only react after the results arrive. The Balanced Scorecard (BSC) splits a strategy into four perspectives — financial, customer, internal process, and learning and growth — so that you hold objectives and measures in balance. This guide covers the four perspectives, the strategy map that links objectives by cause and effect, how to think about choosing KPIs, how the BSC fits with KPIs and OKRs, and the common mistakes, using a small made-up example.
In one line — translate strategy into objectives and measures across four perspectives
The Balanced Scorecard (BSC) is a framework that splits an organization's strategy into four perspectives — financial, customer, internal process, and learning and growth — and places objectives and measures under each, so you can track how the strategy is progressing.
It was proposed by Robert S. Kaplan and David P. Norton, became widely known through their 1992 article in Harvard Business Review, and was set out systematically in their 1996 book. The idea of the strategy map came later.
The starting concern was that financial numbers alone arrive too late. Revenue and profit are the result of past actions, so if you chase only results, you act late. The BSC puts other perspectives alongside finance so you can see the conditions that lead to the results as well.
The four perspectives — what each one asks
Each perspective corresponds to a question like the ones below. You do not have to fill all of them with equal weight; place objectives according to your own strategy.
- Financial: are we delivering the results the business is expected to deliver? (e.g. profitability, growth)
- Customer: are the customers we aim for choosing us, satisfied, and staying? (e.g. retention, referrals)
- Internal process: which operations must be especially strong to deliver value to customers? (e.g. speed of delivery, quality)
- Learning and growth: how do we develop people, systems and knowledge to keep this going? (e.g. skills, tools, learning habits)
The key is to put the financial perspective at the top in a for-profit company (a non-profit puts its mission or customers on top) and to treat the other three as the causes that produce financial results. The BSC also places four things under each perspective: objectives, measures, targets and initiatives. This leads straight into the strategy map.
The strategy map — drawing how objectives cause one another
A strategy map connects the objectives you placed in the four perspectives with cause-and-effect arrows. The basic flow runs from the bottom up: learning and growth improves internal processes, which lifts customer satisfaction and retention, which finally shows up as financial results.
The point of drawing the causes is to avoid ending up with a mere list of measures. Test whether you can explain, with a single line, why improving this objective should improve that one. A line you cannot explain means the hypothesis behind your strategy is still weak.
Here is a small example (a made-up tutoring school).
- Learning and growth: tutors learn a routine for listening to each student's concerns in a one-to-one talk
- Internal process: in the first month after enrolment, always hold an individual talk and build a study plan
- Customer: parents feel "they really look after my child" and keep their child enrolled
- Financial: more students stay, and income becomes stable
This example is invented for illustration. In practice, redraw it in the words of your own business, so that every arrow makes sense to you.
Choosing KPIs — think of the number as "an amount you can look at and act on"
Once the objectives are set, choose the measures (KPIs) that show their progress. What matters is not adding more measures, but choosing, for each objective, something where you can say "if this moved, the objective moved."
There is no fixed right number. As a way of thinking, keep it to an amount that fits on one screen and lets the viewer judge what to do. Keep each perspective to a few measures, and do not let the total grow too large. With too many, people stop looking at any of them.
It helps to mix measures that describe results (lagging indicators) with measures that move ahead of results (leading indicators). In the tutoring school above, retention is a result, while the share of first-month talks actually held is a measure that moves earlier. Leading indicators give you more room to act.
How it differs from KPIs and OKRs, and how to combine them
The BSC is a framework for measuring strategy (a structure). KPIs are the individual measures placed inside it, and OKRs are ambitious goals and results you commit to for a set period. The three do not compete; they do different jobs.
- BSC: the overall framework that organizes strategy into four perspectives and cause-and-effect links
- KPI: the measures you place under each BSC objective and keep watching
- OKR: the ambitious goals and key results you focus on for a period
To combine them, draw the whole picture and its causes with the BSC, watch the health of each perspective with KPIs, and carve out the part you most want to change this period as OKRs. See also our guides on KPI vs OKR and on how to write OKRs.
Common mistakes
The BSC is easy to get wrong if you only fill in the form. Here are the usual stumbling blocks.
- Filling in the four perspectives and stopping (objectives sit side by side, not linked by cause and effect)
- Too many measures, so nobody looks at the whole
- Quietly drifting back to watching only financial numbers
- The measure itself becomes the goal, and behavior aimed at making the number look good grows
- Building it once and never updating it, even after the strategy changes
- Stopping at a leadership diagram that never reaches day-to-day work
The remedy is simple: check that you can explain the "why" of every arrow, cut down the measures, and review them regularly. Starting small and adjusting as you go lasts longer.
From design to operation — decompose into objectives, then track day to day
BSC objectives and measures come from understanding the environment. Read the environment with 3C (Customer, Competitor, Company), organize it with SWOT, derive strategy with Cross-SWOT (TOWS), and break the issues down with MECE (no gaps, no overlaps) — only then can you land objectives and KPIs in the four perspectives, and this period's OKRs.
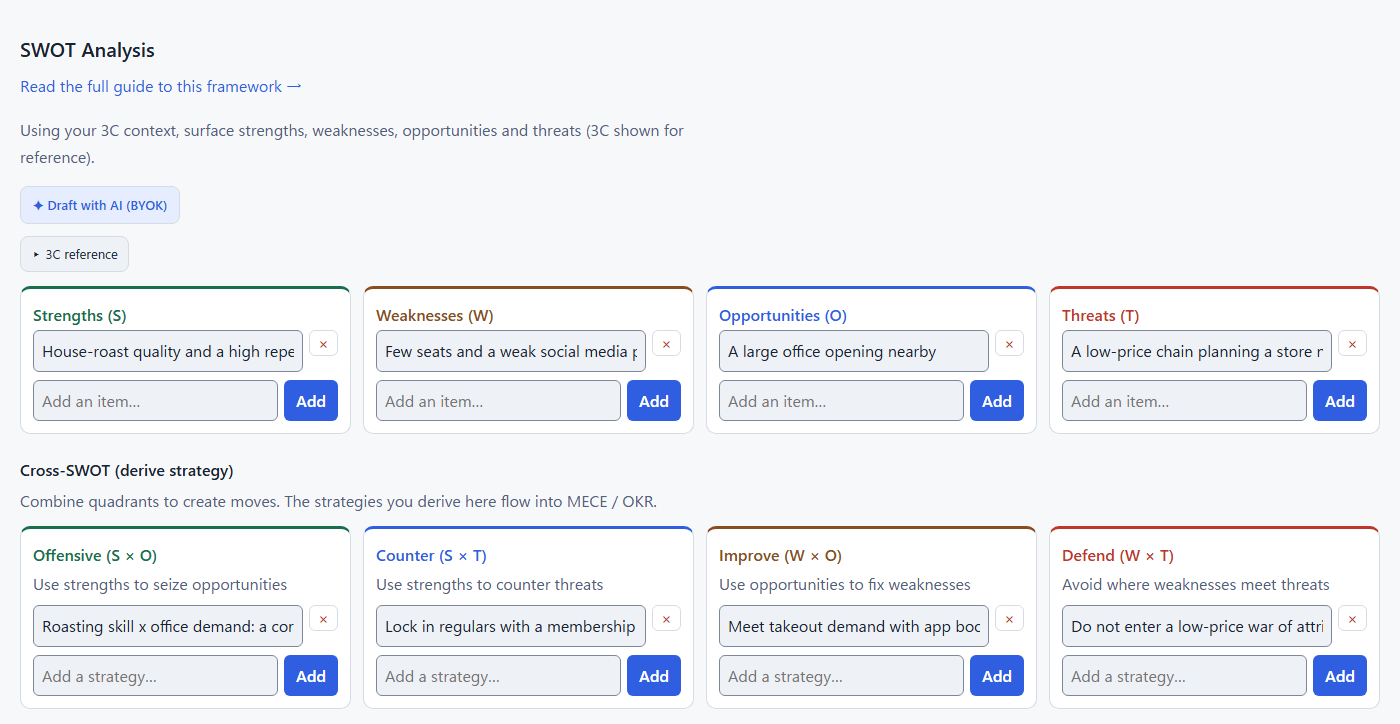
This whole flow — 3C → SWOT → Cross-SWOT → MECE → OKR — is what our strategy cockpit chains on a single screen. Everything you type is stored on your device only (nothing is sent to our servers). You can try AI drafting for free on SWOT using your own API key (BYOK); a one-time $9.90 purchase unlocks AI across every framework.
Tracking those designed KPIs/OKRs as daily numbers over time is where the sister app Baton Board shines. Design here, track day to day in Baton Board — splitting the roles this way makes it sustainable.
FAQ
What is the Balanced Scorecard (BSC)?
It is a framework that splits a strategy into four perspectives — financial, customer, internal process, and learning and growth — and places objectives and measures under each, so you can track how the strategy is progressing. Its aim is to look not only at financial results but also at the conditions that lead to them.
Do I have to fill in all four perspectives?
Not with equal weight. Place objectives in the perspectives your strategy needs. Do check that you have not ended up lopsided toward finance only or customers only, and that the cause-and-effect lines actually connect.
How many KPIs should I set?
There is no fixed right answer. A useful way of thinking is to keep it to an amount that fits on one screen and lets the viewer decide what to do. Keeping each perspective to a few measures, rather than growing the list, means people actually look at them and act.
How do I use the BSC, KPIs and OKRs together?
The BSC is the overall framework that organizes strategy into four perspectives and causal links, KPIs are the measures under it that you keep watching, and OKRs are the goals and results you focus on for a period. A natural combination is to draw the whole picture with the BSC, watch health with KPIs, and turn what you most want to change this period into OKRs.
Who came up with the Balanced Scorecard?
It was proposed by Robert S. Kaplan and David P. Norton. It became widely known through their 1992 article in Harvard Business Review and was set out systematically in their 1996 book. The strategy map idea was added later.
Other guides
- How to Do a SWOT Analysis — Complete Guide with Cross-SWOT (TOWS)
- How to Write OKRs — A Practical Guide with Examples
- How to Do a 3C Analysis — Customer, Competitor, Company
- What Is MECE? — Decompose Any Problem Without Gaps or Overlaps
- How to Use the TOWS Matrix (Cross-SWOT) — Turn Four Quadrants into Strategy
- Strategy Frameworks Explained — Use 3C, SWOT, TOWS, MECE and OKRs Together
- KPI vs OKR — the difference, when to use each, and how to connect them
- Turn Strategy into Execution — Running PDCA and Tracking the Daily Numbers (with Baton Board)
- Strategy Frameworks by Industry — 3C→SWOT→OKR Worked Examples for Four Business Types
- The Limits of SWOT Analysis — and How to Complement Them
- What Is PEST Analysis? Read the Macro-Environment and Feed SWOT
- What Is Porter's Five Forces? Read an Industry's Profit Structure
- What Is Value Chain Analysis? Break Down Internal Activities and Feed SWOT
- What Is the Ansoff Matrix? Choose a Growth Path by Product × Market and Feed OKR
- What Is a Logic Tree? — Break a Problem Down Branch by Branch (What/Why/How)
- What Is VRIO Analysis? Evaluate Internal Resources with Four Questions and Pick SWOT's Strengths
- What Is STP Marketing? Narrow the Market in Three Steps to Decide Who to Serve
- How to Choose a Strategy Framework — Which One, and When
- What Is the BCG Matrix (PPM)? Allocate Resources Across Businesses in Four Quadrants
- What Is Jobs to Be Done (JTBD)? Finding the "Job" Your Customer Needs Done
- Business Model Canvas (BMC): nine building blocks on one page
Try it right in your browser (free, no sign-up)
3C → SWOT → Cross-SWOT → MECE → OKR on one screen. Go from reading the environment and breaking issues down to landing objectives and measurable results. Strategy data stays on your device; AI drafting on SWOT is free (your own API key — BYOK).
Open the app →