Business Model Canvas — draw how a business works on one page, in nine blocks
A business idea can look coherent in your head, yet the moment you put it into words, something is often missing from "who, what, how it reaches them, and how it earns." The Business Model Canvas (BMC) splits a business into nine building blocks on a single page so that you can check how the parts connect. This guide covers what the nine blocks mean, the order to fill them in, how the canvas fits with 3C, SWOT and the value chain, and the common mistakes, using a small made-up example.
In one line — draw how a business works in nine blocks on one page
The Business Model Canvas (BMC) is a framework that lays out, on a single page and in nine blocks, who a business creates value for, what value it offers, how it reaches customers, and how it earns money. Unlike a written business plan, the whole picture fits in one view, so you can see at a glance whether the blocks connect.
It was proposed by Alexander Osterwalder and Yves Pigneur and became widely known through their 2010 book Business Model Generation. The canvas itself is published by Strategyzer under the Creative Commons CC BY-SA 3.0 Unported license.
The descriptions of the nine blocks and the example in this guide are written in our own words; we have not reproduced the original diagram. If you want to use the original diagram itself, follow the source and license terms above.
The nine blocks — customers on the right, delivery on the left
Each block answers a question like the ones below. The value proposition sits in the middle, the blocks that face customers run down the right, the blocks that make it happen run down the left, and the money (costs and revenue) sits along the bottom.
- Customer segments: who are we creating value for? (e.g. a specific group of people with a specific problem)
- Value proposition: which of their problems do we solve, and what value do we deliver?
- Channels: through which routes do we reach them and deliver that value? (e.g. a shop, the web, referrals)
- Customer relationships: what kind of relationship do we keep with them? (e.g. face-to-face advice, automated guidance, a community)
- Revenue streams: what do customers pay for, and how? (e.g. one-off sales, a monthly fee, commissions)
- Key resources: which people, assets, technology, knowledge and funds are essential to deliver the value proposition?
- Key activities: which activities must we do especially well to deliver it?
- Key partners: whom do we team up with to cover what we cannot do alone?
- Cost structure: what are the main costs of running the whole arrangement?
The right side (customer segments, customer relationships, channels, revenue streams) is about who you deliver to and how you earn; the left side (key resources, key activities, key partners, cost structure) is about how you make it happen. Comparing the revenue streams and the cost structure along the bottom gives you a first sense of whether the arrangement can hold together.
The order to draw it — start with customers and the value proposition
There is no fixed order, but it is usually easiest to start with customer segments and the value proposition. Until you know whose problem you are solving, the channels, the revenue and the blocks on the left cannot be settled.
To dig into the customer's problem, the Jobs to Be Done way of thinking helps. If you first put into words the "job" the customer wants done, the value proposition is less likely to become a list of features.
Once the customer side is firm, fill in channels, customer relationships and revenue streams, then move to the left side (key resources, key activities, key partners) and the cost structure. It is normal to go back and fix earlier blocks as you go; do not try to finish it in one pass.
A small example — a subscription of home-roasted coffee beans (made up)
This example is invented for illustration. Imagine a small home-roasting shop starting a subscription for coffee beans.
- Customer segments: people who want good coffee at home but are unsure how to choose beans
- Value proposition: freshly roasted beans, chosen to their taste, arrive at set intervals, so they no longer have to agonize over which to buy
- Channels: the shop's own web page and conversation at the counter
- Customer relationships: ask about taste at the start, then adjust the next delivery based on feedback on the beans received
- Revenue streams: the monthly subscription fee, and extra one-off purchases
- Key resources: roasting skill, the roasting machine, records of each customer's taste
- Key activities: roasting to order, packing and shipping, asking about taste
- Key partners: green-bean suppliers, a delivery company
- Cost structure: green beans, energy for roasting, packaging, shipping, and your own working time
In this example, the customer's problem ("I don't want to agonize over which beans to buy") in the value proposition leads to a relationship of "asking about taste," an activity of "roasting to order," and the skill and records (resources) that support them. Checking that the right side and the left side connect like this is exactly what the canvas is for.
The example is invented for illustration; it is not a real shop and contains no real figures. In practice, redraw it in the words of your own business so that the blocks visibly connect.
How it differs from 3C, SWOT and the value chain
The BMC is a tool for drawing the whole shape of how a business works, as a hypothesis. The other analyses are better suited to gathering material, checking, and digging into parts.
- BMC: the whole shape of the business in nine blocks on one page
- 3C analysis: study customer, competitor and company to read the environment (material for customer segments and the value proposition)
- SWOT analysis: organize strengths, weaknesses, opportunities and threats, and check whether the arrangement you drew fits the environment
- Value chain: break the company's activities down to see where value is created (material for digging into key activities)
To combine them, a natural flow is: organize customer, competitor and company with 3C, draw the arrangement on one page with the BMC, check weak spots and outside changes with SWOT, and review the key activities in detail with the value chain. Once you move to execution, measure progress with KPIs and OKRs.
Common mistakes
With a BMC it is easy to feel you have "drawn it" just by filling in sticky notes, so people often stop at a tidy form. Here are the usual stumbling blocks.
- Filling in the nine blocks and stopping, without checking that the blocks connect
- A customer segment that is too broad ("everyone"), so the value proposition speaks to no one
- A value proposition that is just a list of functions and features
- Leaving revenue streams and cost structure empty, and never checking whether it can earn
- Treating the drawn hypothesis as fact without checking it with customers
- Copying a sample canvas as it is, without putting it into the words of your own business
The remedy is simple. Narrow the customer segment to something specific, state the value proposition as "the answer to that person's problem," and check that the right side and the left side connect. What you draw is only a hypothesis, so test it against what customers say and redraw it as often as needed.
Using it on our site — there is no dedicated BMC screen
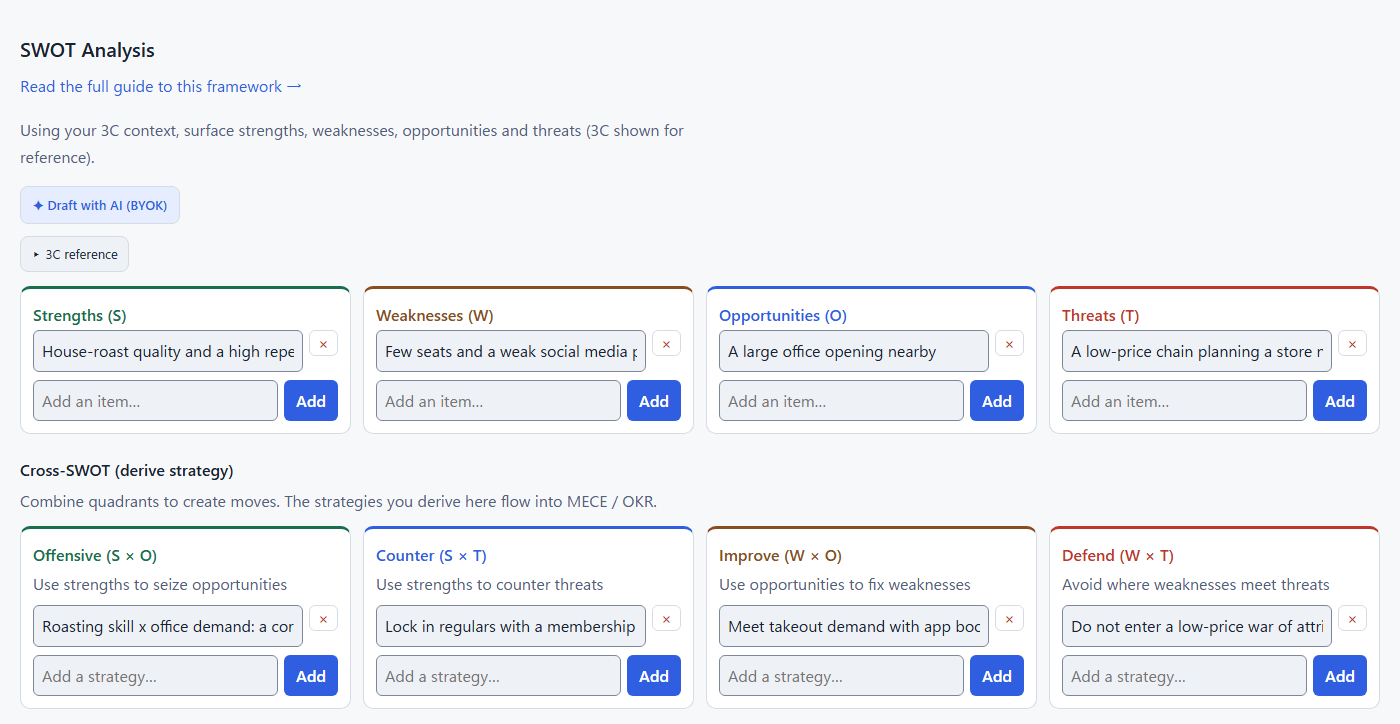
Our site has no dedicated BMC screen. As material for thinking about the right side of the canvas (customer segments and the value proposition), the closest is the 3C screen (customer, competitor, company). Write down customers, competitors and your own strengths there first, then carry that over onto your own canvas.
After that, check the weak points and outside changes of what you drew with SWOT, split the issues with MECE, and turn them into goals you can execute with OKRs. That flow is what our strategy cockpit chains on a single screen. Everything you type is stored on your device only (nothing is sent to our servers). You can try AI drafting for free on SWOT using your own API key (BYOK); a one-time $9.90 purchase unlocks AI across every framework.
FAQ
What is the Business Model Canvas (BMC)?
It is a framework that draws, on one page, who a business delivers what value to, how it delivers it, and how it earns — split into nine blocks: customer segments, value propositions, channels, customer relationships, revenue streams, key resources, key activities, key partners and cost structure. Its aim is to let you check at a glance how the parts connect.
In what order should I fill in the nine blocks?
There is no fixed order. It is usually easiest to start with customer segments and the value proposition. Once you know whose problem you are solving, the channels, customer relationships, revenue streams and the blocks on the left become easier to decide. It is fine to go back and fix earlier blocks as you go.
How do I use the BMC alongside 3C, SWOT and the value chain?
The BMC is a tool for drawing the whole shape of how a business works. 3C reads the environment, SWOT checks strengths, weaknesses, opportunities and threats, and the value chain breaks the company's activities down — each can supply material for drawing the BMC or be used to check it.
Can the BMC replace a business plan?
No. The BMC is a tool for seeing how a business works on one page and testing it as a hypothesis. You still need a separate, more detailed plan, such as a funding plan and numerical outlook.
Who proposed the Business Model Canvas?
Alexander Osterwalder and Yves Pigneur. It became widely known through their 2010 book Business Model Generation, and the canvas is published by Strategyzer under the CC BY-SA 3.0 Unported license.
Other guides
- How to Do a SWOT Analysis — Complete Guide with Cross-SWOT (TOWS)
- How to Write OKRs — A Practical Guide with Examples
- How to Do a 3C Analysis — Customer, Competitor, Company
- What Is MECE? — Decompose Any Problem Without Gaps or Overlaps
- How to Use the TOWS Matrix (Cross-SWOT) — Turn Four Quadrants into Strategy
- Strategy Frameworks Explained — Use 3C, SWOT, TOWS, MECE and OKRs Together
- KPI vs OKR — the difference, when to use each, and how to connect them
- Turn Strategy into Execution — Running PDCA and Tracking the Daily Numbers (with Baton Board)
- Strategy Frameworks by Industry — 3C→SWOT→OKR Worked Examples for Four Business Types
- The Limits of SWOT Analysis — and How to Complement Them
- What Is PEST Analysis? Read the Macro-Environment and Feed SWOT
- What Is Porter's Five Forces? Read an Industry's Profit Structure
- What Is Value Chain Analysis? Break Down Internal Activities and Feed SWOT
- What Is the Ansoff Matrix? Choose a Growth Path by Product × Market and Feed OKR
- What Is a Logic Tree? — Break a Problem Down Branch by Branch (What/Why/How)
- What Is VRIO Analysis? Evaluate Internal Resources with Four Questions and Pick SWOT's Strengths
- What Is STP Marketing? Narrow the Market in Three Steps to Decide Who to Serve
- How to Choose a Strategy Framework — Which One, and When
- What Is the BCG Matrix (PPM)? Allocate Resources Across Businesses in Four Quadrants
- What Is Jobs to Be Done (JTBD)? Finding the "Job" Your Customer Needs Done
- Balanced Scorecard (BSC): four perspectives and a strategy map
Try it right in your browser (free, no sign-up)
3C → SWOT → Cross-SWOT → MECE → OKR on one screen. There is no dedicated BMC screen, but you can start from the 3C screen where you write down customers, competitors and your own strengths, check what you drew, and carry it through to goals with measurable results. Strategy data stays on your device; AI drafting on SWOT is free (your own API key — BYOK).
Open the app →