What Is the Ansoff Matrix? Turning a Growth Direction into OKR
The Ansoff Matrix is a framework that views business growth along two axes — "product" and "market" — and sorts where to grow into four strategies. Igor Ansoff set it out in his 1957 Harvard Business Review article "Strategies for Diversification." Crossing product (existing/new) with market, or customers (existing/new), yields four cells: market penetration, product development, market development, and diversification. The key read is a risk gradient: the further a cell sits from your existing assets, the higher the risk. This guide explains the four cells, the risk gradient, how it differs from SWOT and Cross-SWOT, and how to connect it to OKR, using a café example.
What the Ansoff Matrix is — sorting growth by product × market
The Ansoff Matrix is a 2×2 table that crosses "what you sell (product)" and "who you sell to (market/customers)," each as existing or new. Put existing/new on both axes and four growth paths appear.
Igor Ansoff framed growth as a range from "today's product to today's customers" out to "a new product to new customers," with more unknowns and higher risk the further you go. It gives you an order of preference: examine the paths you can grow with today's assets first, and choose the far cells only with real backing.
The four growth strategies: penetration, product development, market development, diversification (a café example)
Take a small café near a station and look at each of the four cells.
- Market penetration (existing product × existing market): more of today's coffee to today's regulars — raise visit frequency with a loyalty card or stamps. The lowest risk.
- Product development (new product × existing market): new items for your regulars — add a lunch menu or retail bags of your own roasted beans.
- Market development (existing product × new market): today's coffee to a new audience — delivery to nearby offices (B2B), online bean sales, or a second location.
- Diversification (new product × new market): a new product for a new audience — e.g., opening a barista training school. The highest risk; it needs matching preparation.
The risk gradient and how to choose — the further from your assets, the higher the risk
The four cells carry a risk gradient. Market penetration (existing × existing) is lowest because your current strengths apply directly; diversification (new × new) is highest because both product and customer are unknown. Product development and market development sit in between.
A rule of thumb: examine the near cells first. Squeeze market penetration with today's assets, and if that is not enough, make just one side new — the product (development) or the market (development). Choose diversification when you have backing, such as spreading the risk of the core business or a clear opportunity. Forcing a diversification that sits in SWOT's weakness × threat (W×T) is the move to avoid.
Its relationship to SWOT, Cross-SWOT, and 3C — from reading your position to choosing a growth direction
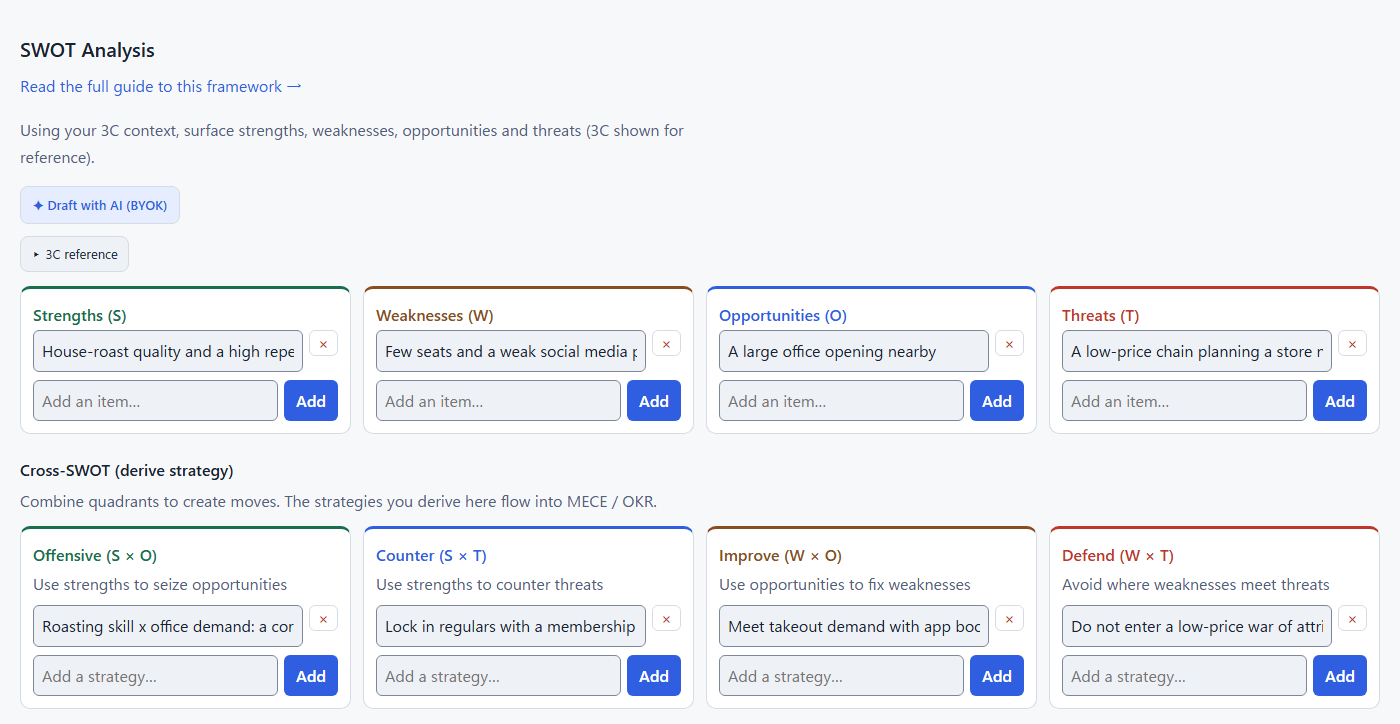
Ansoff is not analysis itself; it is a framework for choosing a growth direction. You analyze the external with 3C, PEST, and Five Forces, the internal with the value chain, and organize it into strengths, weaknesses, opportunities, and threats with SWOT. That gives you "your position."
Taking that position, Cross-SWOT (TOWS) gives the direction of strategy, and Ansoff gives "which product × market cell to grow in." TOWS's aggressive move (strength × opportunity) pairs with penetration or market development; diversification pairs with the higher-risk offensive. Separating analysis (through SWOT) from choice (Cross-SWOT, Ansoff) keeps the discussion aligned.
Run Ansoff → MECE → OKR (turn the direction into measurable targets)
Choosing a cell with Ansoff is still just an arrow pointing "this way." Decompose the chosen cell with MECE (no overlaps, no gaps) into work and attach measurable Key Results. For penetration, put numbers on "visit frequency" and "average spend"; for market development, on "new-channel accounts won."
This 3C/SWOT → Cross-SWOT → Ansoff → MECE → OKR runs on one screen in this strategy cockpit. Everything you enter is stored only on your device (nothing is sent to our servers), and you can try the AI draft in SWOT for free with your own API key (BYOK; you cover only the API usage). A one-time $9.90 purchase unlocks the AI across all frameworks. Daily number tracking can be handed off to the sister app, Baton Board.
FAQ
Which of the four Ansoff cells is the lowest and highest risk?
The lowest is market penetration (existing product × existing market), where your current strengths apply directly. The highest is diversification (new product × new market), because both product and customer are unknown. Product development and market development sit in between. Examining the near cells first is the standard move.
How do I choose between the Ansoff Matrix and SWOT / Cross-SWOT?
SWOT organizes your position into strengths, weaknesses, opportunities, and threats, and Cross-SWOT (TOWS) crosses them to derive the direction of strategy. Ansoff is a framework for choosing "which product × market cell to grow in," and it fits well after Cross-SWOT. Use them in order: analysis (SWOT) → direction of strategy (Cross-SWOT) → choice of growth cell (Ansoff).
What is the weakness of the Ansoff Matrix?
Because it looks only at the product and market axes, it does not tell you the "how" of execution (build in-house vs. partner or acquire) or the resources and timing required. The risk levels per cell are only a guide. That is why you confirm feasibility with SWOT, decompose with MECE, and land it into measurable OKR targets.
Can you give concrete examples of the Ansoff Matrix (a café example)?
Market penetration — more visits from today's regulars via a punch card or coupon book. Product development — a new menu item, or in-house-roasted beans sold at the counter. Market development — delivering the same coffee to nearby offices (B2B), online bean sales, or a second store. Diversification — opening a barista training school, a new product for a new audience.
When was the Ansoff Matrix devised?
Igor Ansoff set it out in his 1957 Harvard Business Review article "Strategies for Diversification."
Other guides
- How to Do a SWOT Analysis — Complete Guide with Cross-SWOT (TOWS)
- How to Write OKRs — A Practical Guide with Examples
- How to Do a 3C Analysis — Customer, Competitor, Company
- What Is MECE? — Decompose Any Problem Without Gaps or Overlaps
- How to Use the TOWS Matrix (Cross-SWOT) — Turn Four Quadrants into Strategy
- Strategy Frameworks Explained — Use 3C, SWOT, TOWS, MECE and OKRs Together
- KPI vs OKR — the difference, when to use each, and how to connect them
- Turn Strategy into Execution — Running PDCA and Tracking the Daily Numbers (with Baton Board)
- Strategy Frameworks by Industry — 3C→SWOT→OKR Worked Examples for Four Business Types
- The Limits of SWOT Analysis — and How to Complement Them
- What Is PEST Analysis? Read the Macro-Environment and Feed SWOT
- What Is Porter's Five Forces? Read an Industry's Profit Structure
- What Is Value Chain Analysis? Break Down Internal Activities and Feed SWOT
- What Is a Logic Tree? — Break a Problem Down Branch by Branch (What/Why/How)
- What Is VRIO Analysis? Evaluate Internal Resources with Four Questions and Pick SWOT's Strengths
- What Is STP Marketing? Narrow the Market in Three Steps to Decide Who to Serve
- How to Choose a Strategy Framework — Which One, and When
- What Is the BCG Matrix (PPM)? Allocate Resources Across Businesses in Four Quadrants
- What Is Jobs to Be Done (JTBD)? Finding the "Job" Your Customer Needs Done
- Balanced Scorecard (BSC): four perspectives and a strategy map
- Business Model Canvas (BMC): nine building blocks on one page
Try it right in your browser (free, no signup)
Choose a growth direction with Ansoff, then move to SWOT → Cross-SWOT → MECE → OKR. One screen; strategy data stays on your device; the SWOT AI draft is free (BYOK).
Open the app →